Visualizing strongly connected components
June 2020. Boredom hits hard, especially when you are under house arrest.
So I decided to understand and visualize how my friends on Facebook were connected.
Here's what we will need:
1. Data : A dictionary. Key=Friend, Value=List of mutual friends
2. Visualization method : I decided to choose Gephi for this.
Unlike good old times, Facebook deprecated most of its APIs. Not letting easy access to information. Classic Zuck.
So to get a list of friends and the mutuals with each one of them, I had to scrape my way out of it.
My dataset being of around 1000 keys, roughly took around 60 mins to scrape. (One can scale up to 5000 friends - max number)
Part I: Getting data in the required format.
Scroll down on your Facebook friends tab, let all the HTML load, and save it in a file.

The HTML content comprises div items as shown below, which have a friend's profile URL.
We shall identify ~1000 of them.
Eg. https://www.facebook.com/FriendUsername

Below is the regex used to fetch all URLs. It may change from time to time so keep an eye.

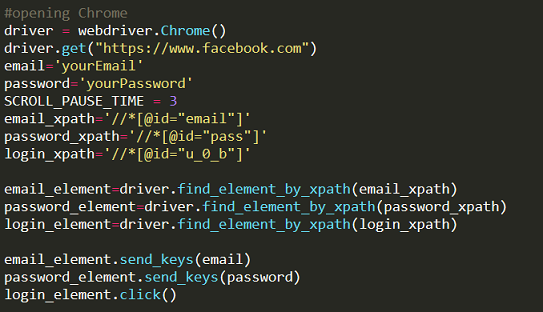
Once we get hold of all the URLs for friends' profiles, it's time to hit them on chrome using selenium.
We start by identifying the UI element, xpaths, setting user creds, and sending keys. Followed by hitting the Login button. Below is the code:
Session Created!
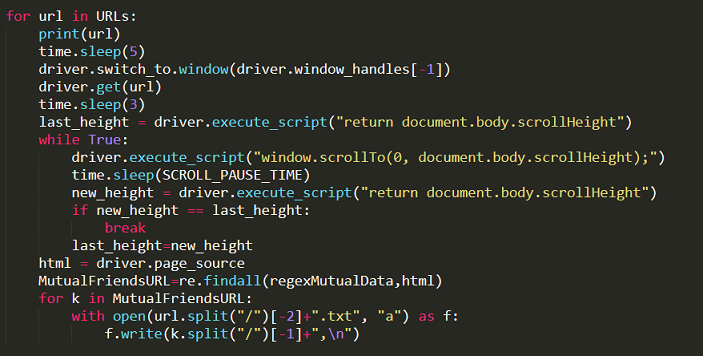
Now it is just about parsing through the list of URLs we obtained earlier.
Switch to a new window, open the friend's profile.
Eg. https://www.facebook.com/username/friends
This shall list down all the mutual friends on the UI.
I added some additional code to scroll down the page. (in case we have a lot of mutual friends and we need to scroll down to get the full list)
Repeating earlier steps, once the page is fully loaded, we fetch the page source and use regexMutualData to get the URLs of all mutuals for a particular friend.
Additionally, we create a file with the username and store the username of mutual friends on each line as file content.
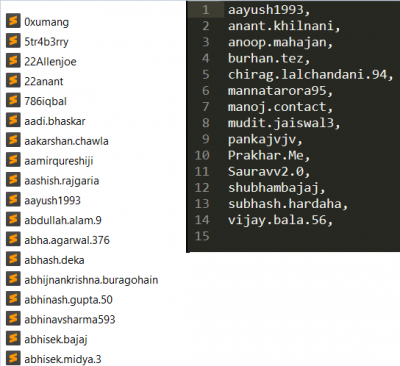
Final result:
List of files. Each file corresponds to a friend and contains a list of mutuals between us.
Alright, we just ate the ugliest frog. Things should be sunnier from here on.
Part II: Visualization on Gephi
Gephi is a dope tool to visualize graphs. I'll run through the basics for now.
It comprises of two primary inputs: nodes and edges.
Create a project and set up your workspace.
Click on Data Laboratory and find Nodes/Edges as shown. We need to feed this data. Use the export table option.

Node File:
Each friend is assigned an ID (0,1,2,3,4.. and so on. )
Edge File:
For each node ID define an edge and set its type.
These two files can be easily created using the data we stored earlier. (Leaving this as an additional exercise)
Refer to the below images to get an understanding.

Let's import these two files onto the workspace. Choose below parameters for starters and later you can build on top of it.
The screenshot below is for the nodes table. Repeat for edges.

This should mark the import of required data.
Go to Overview on the top left and your scattered collection should be there.
Since everything from here is better off self attempted, I'll leave it as an exercise (also because I'm tired)
In gist, set Partition and Ranking on the left side panel.
Add filters from the right tab. Choose your layout. Set properties. Run with set values. What else?
Enjoy visuals.
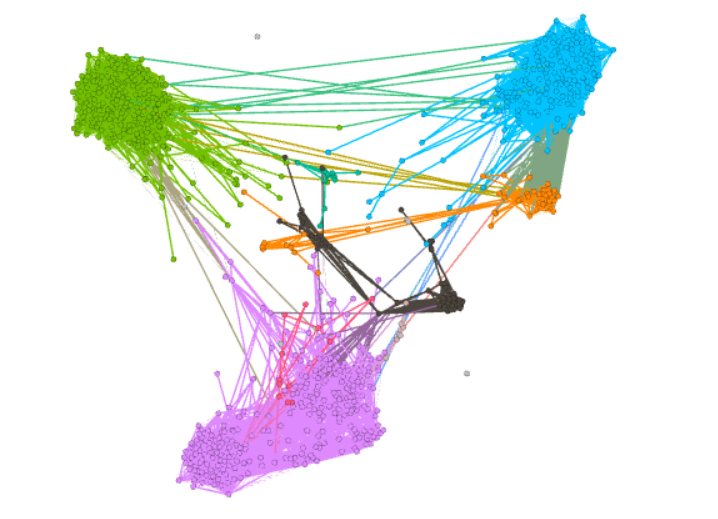
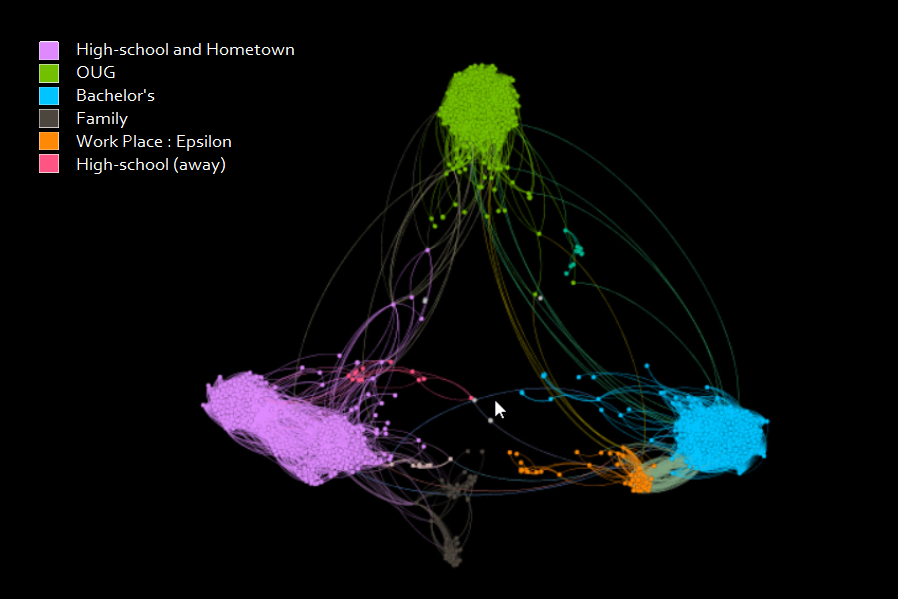
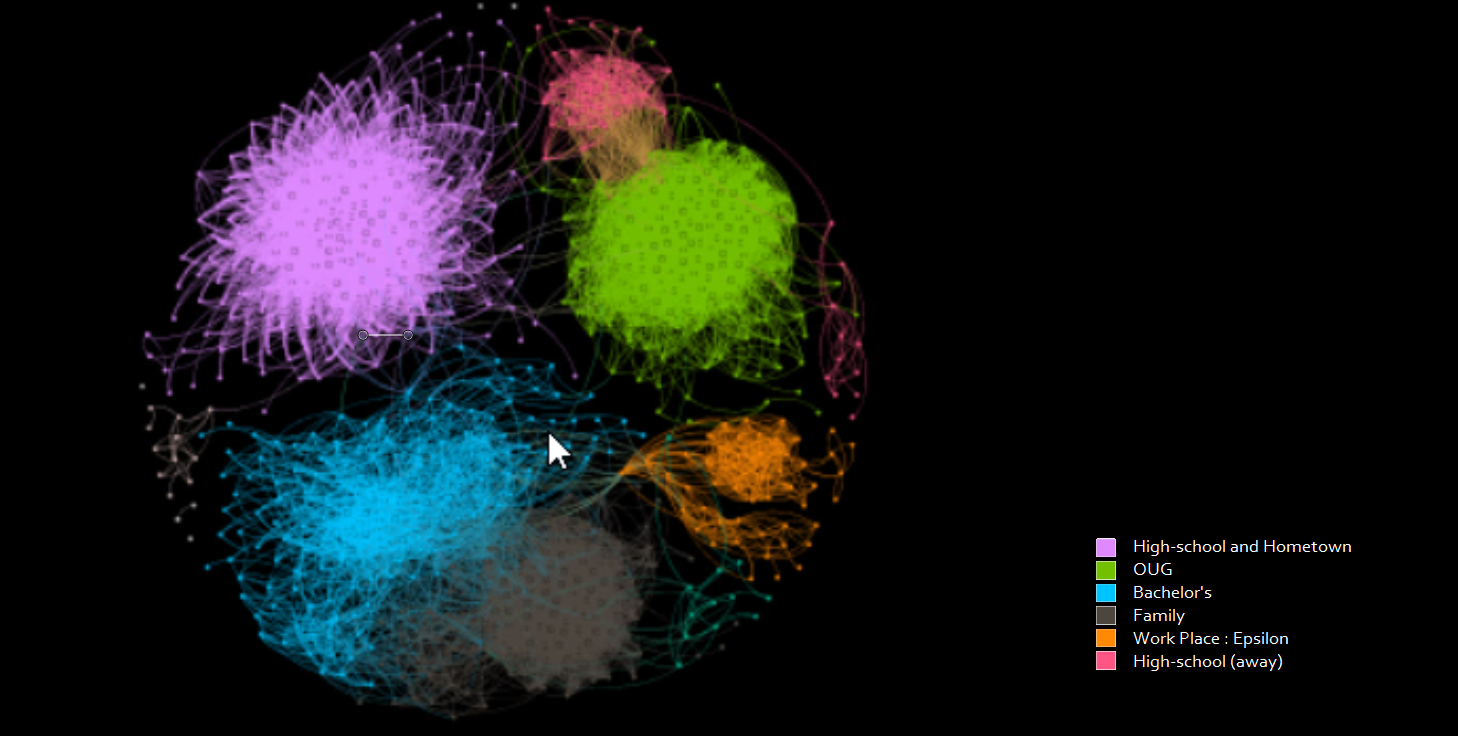
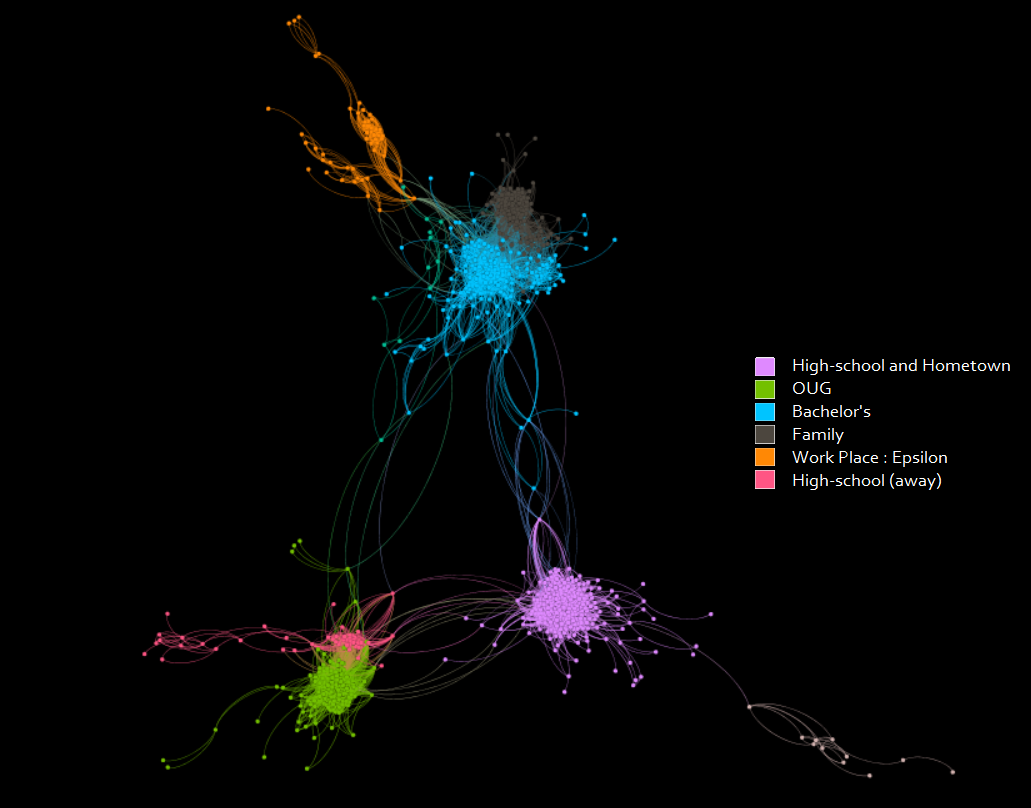
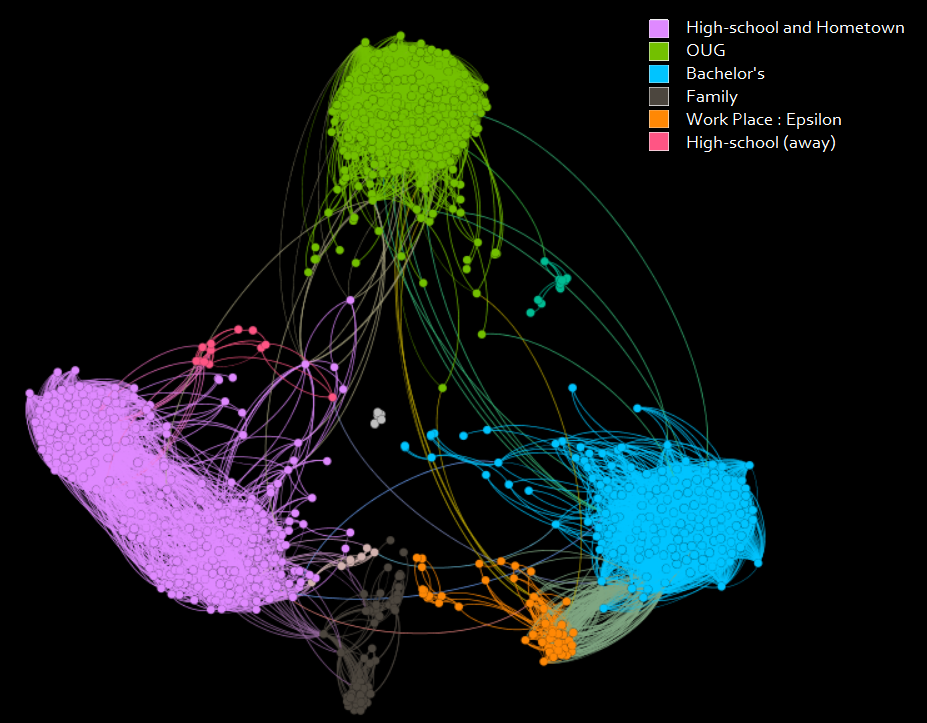
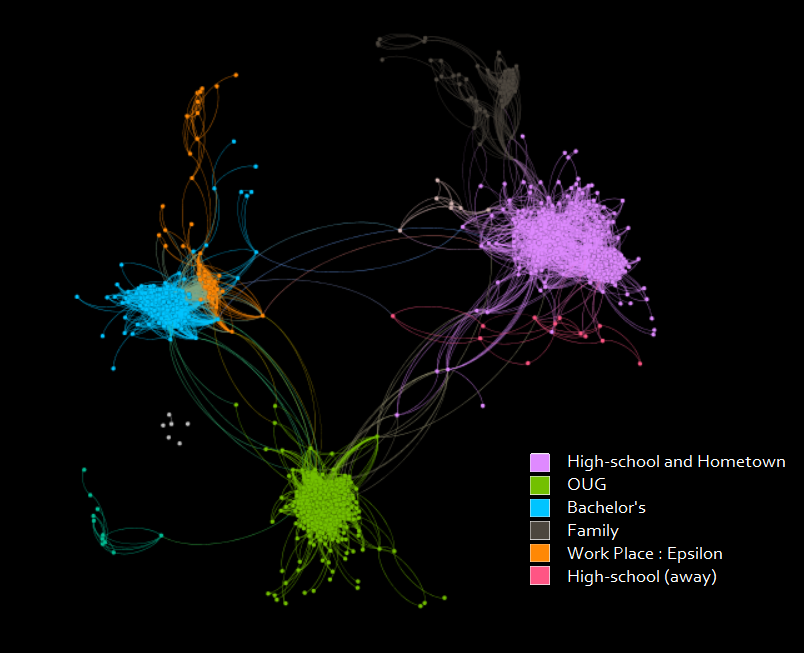
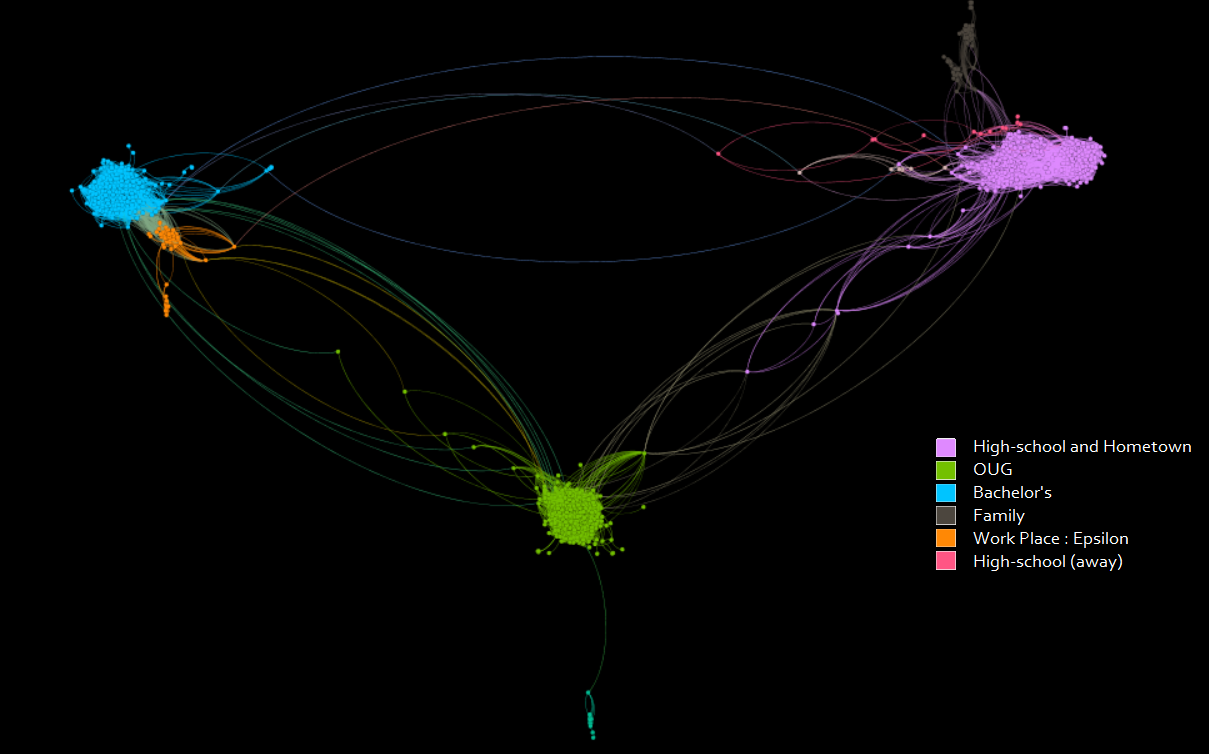
I removed the labels for better and clearer graphs, but the labels depict which friend is connected to you through whom and so on.
Improvements:
Add weights while importing data and get even more realistic derivations.
I went on using this learning while developing a Recommendation System.

Here are the final results based on different layouts and properties.
Description
Data Visualisation
18.06.2020
An attempt to understand where does my 1000 Facebook friends really come from?
